Here is an example of what really the "science that proved that crop circles are mysterious extraterrestrial messages" or some paranormal or alien phenomena really amounts to when it is not just flatly believed.
At: http://www.culture-crop.com/scienceetcropcircle.htm
We read:
|
Dr Sampath Iyengar : A researcher mineralogist of San Diego in California discovered that the clay samples taken in the crop circles showed a model of crystallization so ordered that it would have been necessary that these samples were taken in geological sediments subjected to very strong pressures during several million years. http://web.archive.org/web/20030101184436/http://www.geomantica.com/magissue/geom18.htm |
Gosh!
No doubt, there must be some holy "scientific study which proves" this, with all the peer-reviewing and published in a prestigious professional scientific journal?
Well, if you go the indicated web page, you would discover that it's actually gone, but it is preserved from oblivion thanks to the services archive.org. It is actually a magazine's page:
|
Geomantica 18 |
What is that all about?
|
Earth mysteries / energies, esoteric agriculture and Earthcare PO Box 929 Castlemaine Vic. 3450, Australia. |
Quite a science journal! The electronic bulletin of an Australian lady...
Undoubtedly of purely scientific contents, peer-reviewed, isn't it? Let's see the table of contents of this bulletin by Alanna Moore, Castlemaine, Australia.
Contents:NZ: River Monsters & Earth Wisdom |
Hard bullet-proof science. My chakras go bump!
"Changes in Soil & Plants in Crop Circles"... some unquestionable scientific demonstration?
Well, nope. All that you find is a text that the author of this web page nicked fron the "Weekend Australian magazine, Oct. 19-20 2002".
No science at work here!
This is just some Australian "New Age" bulletin who stole from an Australian general interest magazine an article praising research I already showed to be flawed...
And on it goes, as the article of "Weekend Australian Magazine" is nothing more than a rewriting of an article titled "Crop Circles Continue To Baffle Scientists" written by Leslie Kean and... Nancy Talbot. (see Filers' Files N 38 of 2002). It appeared in some newspapers such as The Providence Newspaper of San Francisco for September 16, 2002, signed by Leslie Kean only.
But to Anne Moro, this source, is, remember...
|
Dr Sampath Iyengar : A researcher mineralogist of San Diego in California discovered that the clay samples taken in the crop circles showed a model of crystallization so ordered that it would have been necessary that these samples were taken in geological sediments subjected to very strong pressures during several million years. http://web.archive.org/web/20030101184436/http://www.geomantica.com/magissue/geom18.htm |
Here is what Anne Moro does not tell.
These "studies"... is actually, again, the one and only same old "BLT Research" study. The trick is very often used: there is actually only one study behind all this, but as there are 6 people signing them name somewhere in it, it is produced under the name of the one sometimes under the name of another, which creates the illusion that there are "many scientific studies" that "have proven" etc.
BLT Research's study appears naturally everywhere, including dubious "New Age" newsletters between the naked woman who perform the rain dance, the Monster of the River, the Wisdom of the Earth and the anti-nukes activist's interview. Why not, but to put this under the "Science" headline as scientific proof that crop circles are extraterrestrial messages, mmmh, that's a bit daring I think.
And so on Anne Moro's website, this one and only BLT Research study appear no less than three times as if they were three independent studies. Not so!
In fact, I had explained to Anne Moro and other readers of a discussion group why this study was not valid.
No sensible answer followed. On the other hand, it did not take long for the discussion forum's administrator to decides to close it. I'm getting used to that. On many so-called "ufology" discussion groups here in France, armies of gullible fanatics prevail, they cannot bear contradiction, and the administrators generally choose their side. to those people, crop circles are "mysterious" at least, if not aliens or paranormal, and any other opinion is simply not tolerated.
I'll come back to what I had told then; but I must first confess that for Anne Moro and many others, everything I say is perhaps without value by definition since I am "not a scientist" while people who make these studies are scientists, therefore, they are right and I am wrong, period.
Before delivering my "non-science" due to lack of diplomas that these scientists are said to have (when they don't they make one up!), I thus first want to provide the opinion of bona fide scientists, those of the NIDS, a now defunct organization that gathered scientists interested by "borderline subjects" such as UFOs, animal mutilations, etc.
In other words, NIDS was never a debunkers' conspiracy. Their review is sympathetic to the matter, with encouragement to better study the subject. But do not mistake the academic courtesy of their review, it is the bottomline that matters.
Here is what the NIDS scientists found out when by examining the "crystallization which proves that..." study:
http://www.nidsci.org/articles/blt_review.html
We learn this:
Nancy Talbott, who had no scientific diplomas, is the Study Director. Do not wave your "scientists" at me if they aren't!
Talbott said that the report is not written in standard scientific format with references because she was in a hurry to disseminate the content.
Talbott ensures that the authors "will" submit a more formal paper to a scientific journal with peer-reviewing process in the future. But of course, proponents repeatedly rant about "peer-reviewed BLT research." It is not true. The paper was not peer reviewed and published ever.
Reynolds, a scientist of whom Talbott says he validated the study, received the data for only 15 samples out of the 83!
The index Kubler (KI) (measurement of the development of crystals) shows no difference between the samples taken in the crop circle and outside, and that even the spectroscopy by x-ray did not show any marked difference. What magic trick produced the claimed difference? "Statistics." what were these statistics about? Well, they were not done on the data of the 83 samples, but on only the 15 samples that were shown to him!
NIDS people comments on that the number of samples was not enough for a conclusive study. 83 samples are not enough, they say.
But then, what about 15 only?
Science at work, isnt it?
In fact, NIDS shows very well why this study does not have at all the value of scientific proof that Anne Moro grants it:
|
Read the above carefully. The crucial point is that in the study of BLT, there are no difference between the samples taken in the crop circle and those taken outside, that there was some use of some "statistics", and that it was after these "statistics" were applied that, miraculously, and if one examines only 15 of the 83 "statiticated" samples, a "difference" is born. Well, NIDS people tell you this: where is the justification for the use of these miraculous "statistics"?
Scientific proof? Come on!
Already at this stage of my checking, it is clear that this alleged scientific proof is no proof at all. When a study is reviewed by peers is rejected, and does not appear in any scientific newspaper, talking of scientific proof like crop circle buffs do is a fraud.
So I could stop right there!
But I won't.
Dr. Sampath S. Iyengar, a mineralogist, is the director of Technology of Materials Laboratory, in California. This is not a university research laboratory, but a private company. Their website is www.xraydiffrac.com. They published more a score of scientific papers relating to material analyses by means of X-rays, but their report for BLT is in no way a scientific paper. It is a lab report, which is by no means subjected to the least peer-reviewing but simply the result of the analysis ordered by the customer, BLT. There is nothing abnormal here, but if somebody tells you that Dr. Sampath S. Iyengar wrote a convincing scientific paper about the crop circles, or a convincing scientific publication about crop circles, that's not what it is.
What BLT required of him is a full-blown mineralogyanalysis. His technique is to measure the diffraction of x-rays in materials, and by showing how the rays are diffracted, it indicates the presence of crystalline materials, but also their types and amounts. Soil contains more or less of one or other crystalline materials, such as quartz, mica, feldspar etc, They can be distinguished the ones the others by the way the x-rays are diffracted: the pattern is simply matched to an international database of diffraction patterns. This is generally done automatically by the data-processing software: it collects the data of the device and makes the query in the data base automatically. I am not a mineralogist myself, but I am familiar with the process as I spent 10 years to install such software and maintain in good working order the computers on which they run.
It must be clear: the point was not about showing that crystals "grow" in the ground when an UFO or a "strange phenomenon" occurred, it was only about showing which kinds of crystalline minerals were in each soil sample, and how much there were.
In fact, in such a situation, the good scientific procedure is that the analyst should know nothing about the expected results and what they are expected to show or refute, so that such knowledge cannot consciously or unconsciously lead to bias in the results to satisfy a known preference of the analyst, or in this matter, of his customer. In fact, the correct scientific procedure required that Dr. Sampath S. Iyengar ignores that the samples have anything to do with crop circles. It would then have been a "blind test."
Unfortunately, a problem appears with the assertion that Dr. Sampath S. Iyengar "was completely unfamiliarized with the crop circles phenomenon and any controversy around this subject", and that his analysis is "thus protected from any bias."
This is not good. The good scientific practice would have been not to tell him at all that the analysis is related to crop circles. The good practice would have been to send the samples to him without any information of a relation with crop circle, and without any indication as of the location of the samples and which one are control samples.
But the analyst was informed, as the BLT Research web page shows on Dr. Sampath S. Iyengar's report.
|
Source: "X-Ray diffraction analysis", "Dr. Iyengar's full report follows below", web page by BLT Research at http://www.bltresearch.com/xrd.html
But there was no requirement to inform him. On the contrary, here was a good opportunity to perform a blind test analysis. Instead of seizing the opportunity for a blind test, BLT Research, the "customer", made all the opposite by informing the "supplier" on their expectation: the hope to discover an "anomaly."
This shows that the analyst knew which samples were the control and which one were from the crop circles:

|
We see above that the analyst was completely informed, even of the very localization of each sample.
When BLT Research ensures that there cannot be any bias of the analysis under the motive that he is completely ignorant of the topic of crop circles, a fundamental mistake is made.
From the scientific point of view, the case is dead again: on such important and controversed matters, it was necessary to perform double blind tests, and not even blind tests were performed. BLT Research spent 20.000$ while ruining the work with no reason: any reviewer would point out that before claiming scientific proof that crop circles are not made by people, the exigible minimum is that double blind tests are performed.
Will the crop-circles experts one day conform to the requirements of a scientific study? I can only note that it is not the case here.
So, I again could stop right there.
Let's assume that all the points I mentioned were false or without any significance. Let's suppose that the tests were double blind-tests, that we are dealing with a real scientific paper and not a simple web page, that all was checked and approved by peers, then published, instead of being checked and rejected by the NIDS guys, and so on.
Then, the result would be as follows:
At a certain place where a crop circle was made, one finds more mica inside the flattened crop that outside.
This, actually, proves absolutely anything. The soil could just as easily have been less crystalline under the flattened crop than besides.
All the geologists and mineralogists know it: the soil is not some sort of homogeneous medium. There are pronounced rock outcrops here, more earth there, some sedimentary grounds a bit further etc. If the soil was that homogeneous, there would be no need for geology.
And of course, there is no reason at all why the soil under a crop circle should be the same than the nearby soil.
At any place where a crop circle was made, the ground can be different under the flattened crop than nearby. This is nothing extraordinary, it has nothing to do with aliens or exotic phenomena and does not prove at all the crop circle was not made by people who just flattened the crop.
In any given time, perfectly valid study of the soil under any crop circle could show that the soil under the crop circle is not the same as outside the crop circle!
Whereas this is perfect common sense, how can it be that the crop circles mystery proponents state otherwise from this study?
Well, this required the use of the words "heat" and "impossible".
Your are told: "if there had been a heat sufficient to make the ground more crystalline there, then the plants of this crop circle would have been burned! You need at least 600° or 800° of heat in the laboratory to do this!"
This is so fallacious reasoning that everyone should realize it, but as regards crop circles, the most obvious becomes "scientific evidence" of the opposite.
Come on, let's have a little common sense!
what supports the notion that this crystallization occurred while a crop circle appeared?
Nothing!
A crystalline ground does not need a crop circle, it forms in geological times, and if millions of years later somebody creates a crop circle there, well, this crystallization there since long and there is nothing extraordinary in the observation that the plants are not burned...
With the crop circle experts' reasoning, you could just as easily claim that a road was created by the passing of the cars because roads don't appear in the lab without some heat that would damage cars tires...
Crop circle proponents talk as if the more important proportion of mica crystals in this ground is geologically impossible, because the geological process would require that this ground be crushed by massive pressure during geological times, which is impossible since that it would have burned the plants.
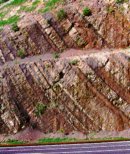
|
Left: what's deep in the ground at one time can be at the surface later. Basic geology! |
Let's go back to the BLT report:
|
"If such a change were to be demonstrated (with statistical significance) in surface soils in an in-depth study at crop circle sites, it would certainly inspire increased academic interest in the causative mechanism behind the crop circle phenomenon." |
They say that if the soil was demonstrated to be generally more crystalline under a statistically significant number of crop circles, it would demonstrate that they are not made by people.
But then again, how many analysis were performed on how many crop circles formations?
One, just one!
How can this be "statistically significant" already? It just can't. We have BLT stating that it might become significant IF it happens in a statistically significant number of similar cases, and we have crop circles experts who claim this is already the scientific proof that crop circles are aliens messages and whatnots.
According to BLT Research, a significant anomaly was shown.
Let's look at the numbers.
"Table 1" is about control samples taken outside the circles, the numbers are:
| Sample # | RT | Glycolated |
|---|---|---|
| 1 | 0.18 | 0.17 |
| 2 | 0.17 | 0.18 |
| 3 | 0.18 | 0.16 |
| 4 | 0.16 | 0.19 |
| 5 | 0.16 | 0.20 |
| 6 | 0.10 | 0.16 |
| 7 | 0.16 | 0.14 |
| 8 | 0.19 | 0.20 |
| 9 | 0.22 | 0.20 |
| 10 | 0.21 | 0.22 |
| 11 | 0.18 | 0.20 |
| 12 | 0.27 | 0.26 |
| 13 | 0.23 | 0.24 |
| 14 | 0.19 | 0.20 |
| 15 | 0.24 | 0.20 |
| 16 | 0.25 | 0.40 |
| 17 | Missing! | Missing! |
| 18 | 0.20 | 0.20 |
| 19 | 0.29 | 0.20 |
| 20 | 0.17 | 0.22 |
| 22 | 0.15 | 0.16 |
| 23 | 0.22 | 0.16 |
"Table 2" is about samples taken in "circle A", the numbers are:
| Sample # | RT | Glycolated |
|---|---|---|
| 64 | 0.12 | 0.20 |
| 65 | 0.13 | 0.21 |
| 66 | Missing! | Missing! |
| 67 | 0.15 | 0.19 |
"Table 3" is about samples taken in "circle B", the numbers are:
| Sample # | RT | Glycolated |
|---|---|---|
| 41 | 0.30 | 0.20 |
| 42 | Missing! | Missing! |
| 43 | Missing! | Missing! |
| 44 | 0.17 | 0.22 |
| 45 | 0.14 | 0.17 |
| 46 | 0.14 | 0.18 |
| 47 | 0.13 | 0.14 |
| 48 | Missing! | Missing! |
| 49 | 0.17 | 0.18 |
| 50 | 0.17 | 0.14 |
| 51 | 0.23 | 0.23 |
| 52 | 0.15 | 0.16 |
| 53 | 0.12 | 0.14 |
| 54 | 0.17 | 0.22 |
| 55 | 0.17 | 0.20 |
| 56 | 0.20 | 0.22 |
| 57 | 0.17 | 0.17 |
| 58 | 0.17 | 0.15 |
| 59 | 0.19 | 0.23 |
| 60 | 0.19 | 0.38 |
| 61 | 0.17 | 0.23 |
| 62 | 0.13 | 0.27 |
| 63 | 0.15 | 0.13 |
"Table 4" is about samples taken in "circle C", the numbers are:
Note: in the original table, sample 8 was placed between the 5 and 6 instead of being in good order between 7 and 9.
| Sample # | RT | Glycolated |
|---|---|---|
| 1 | 0.25 | 0.18 |
| 2 | 0.17 | 0.16 |
| 3 | 0.20 | 0.16 |
| 4 | 0.18 | 0.25 |
| 5 | 0.13 | 0.25 |
| 6 | 0.18 | 0.21 |
| 7 | 0.25 | 0.25 |
| 8 | 0.09 | 0.12 |
| 9 | 0.22 | 0.20 |
| 10 | 0.18 | 0.19 |
| 11 | 0.18 | 0.13 |
| 12 | 0.15 | 0.11 |
| 13 | 0.13 | 0.18 |
| 14 | 0.14 | 0.11 |
| 15 | 0.15 | 0.15 |
| 16 | 0.14 | 0.17 |
| 17 | 0.18 | 0.18 |
| 18 | 0.16 | 0.18 |
| 19 | 0.20 | 0.14 |
| 20 | 0.20 | 0.18 |
| 21 | 0.18 | 0.19 |
| 23 | 0.17 | 0.15 |
| 24 | 0.18 | 0.23 |
| 25 | 0.19 | 0.18 |
| 26 | 0.11 | 0.26 |
| 27 | Missing! | Missing! |
| 28 | 0.22 | 0.15 |
| 29 | 0.21 | 0.21 |
| 30 | 0.14 | 0.14 |
| 31 | 0.23 | 0.19 |
| 32 | 0.16 | 0.18 |
| 33 | 0.21 | 0.22 |
| 34 | 0.17 | 0.13 |
| 35 | 0.19 | 0.20 |
| 36 | 0.18 | 0.18 |
| 37 | 0.20 | 0.17 |
| 38 | 0.13 | 0.13 |
| 39 | 0.15 | 0.19 |
| 40 | 0.21 | 0.22 |
| Center | 0.22 | 0.18 |
It is advisable to rewrite these tables, because the sampling points as listed do not reflect their relative positions but a non-significant order.
According to the sampling plan, the samples are distributed as follows:
From 17 to 24, the samples are taken in a straight line, with intervals of 7.60 meters, at distance from 50 or 80 meters (it is not specified more exactly) from the crop circles, we thus have a series "Control1" with:
| Sample # | RT | Glycolated |
|---|---|---|
| 17 | Missing! | Missing! |
| 18 | 0.20 | 0.20 |
| 19 | 0.29 | 0.20 |
| 20 | 0.17 | 0.22 |
| 22 | 0.15 | 0.16 |
| 23 | 0.22 | 0.16 |
| 24 | Missing! | Missing! |
The other control samples are indicated to be taken in others such lines with intervals of 7.60 meters, at a distance from 50 or 80 meters (it is not specified more exactly) from the crop circle, but the localization and the distribution of these samplings are not indicated. It is thus not possible to determine how many different lines gave the figures for samples 1 to 16. However, as it there 24 samples, with a series of 8 in a line, it is possible to imagine that the 16 others are by 8 out of two lines, which gives:
|
"Control2":
|
"Control3":
|
We have then taking away in a "Circle A", which is one of the 2 smaller circles of a diameter of 5.70 meters. There are according to the plan 5 samples inside circle A in a diagonal line, numbered on the plan as 64, 65, 66, 67, 68. We thus have "CircleA" with:
| Sample # | RT | Glycolated |
|---|---|---|
| 64 | 0.12 | 0.20 |
| 65 | 0.13 | 0.21 |
| 66 | Missing! | Missing! |
| 67 | 0.15 | 0.19 |
| 68 | Missing! | 0.19 |
The next series consists of two diagonals of sampling orthogonal one to the other in one of the 4 mid-size circles of 10 meters in diameter.
We thus have the series "circleB1" from 41 to 51 and "circleB2" from 52 to 62, with sample 46 common to the two series as it is at their intersection according to the plan:
|
|
Lastly, we have "circle C", the single larger circle of 30.50 meters, for which the samples are taken in 4 regularly spaced diagonals. According to the sampling plan, this gives us 4 series in line "circleC1" to "circleC4" whose values are:
|
"circleC1":
|
"circleC2":
|
|||||||||||||||||||||||||||||||||||||||||||||||||||||||||||||||||||||||||
|
"circleC3":
|
"circleC4":
|
|||||||||||||||||||||||||||||||||||||||||||||||||||||||||||||||||||||||||
Now that we relocated the figures according to the localization of the samples, it becomes possible to look for possible anomalies.
A first possible anomaly would be revealed if the average values of the different sampling showed a significant variation between those in the circles and those outside the circles.
Of course we can calculate the averages by gathering the samples in two groups only, the control group and the circles group. This makes essential facts disappear, for example the fact that Control2 has same RT value as circleB2 disappears.
Whith this grouping, we should have lower values in the control group than in the group taken in the crop circles, since a lower value means more crystallization.
This grouping gives:
All control samples (1 to 23):
0.196
0.202
all samples from inside the circles:
0.174
0.186
Yes, this shows a slight difference! But is this total difference significant? Does the averaging really demonstrate an anomaly?
Here is the averaging for each sampling line:
| RT | Glycolated | |
|---|---|---|
| Contrôle1: | 0.206 | 0.188 |
| Contrôle2: | 0.163 | 0.175 |
| Contrôle3: | 0.224 | 0.240 |
| circleA: | 0.133 | 0.200 |
| circleB1: | 0.181 | 0.182 |
| circleB2: | 0.163 | 0.206 |
| circleC1: | 0.188 | 0.195 |
| circleC2: | 0.168 | 0.155 |
| circleC3: | 0.180 | 0.187 |
| circleC4: | 0.186 | 0.180 |
We can now sort these averages by order of values. If there is an anomaly, the averages coming from the circles must be definitely distinct from the averages of the samples taking outside the circles.
But is is not so:
RT: |
||||||||||||||||||||||
|
|
|||||||||||||||||||||
Glycolated: |
||||||||||||||||||||||
|
|
|||||||||||||||||||||
Let's now try with each circle.
We have:
| RT: | Glycolated: | |
|---|---|---|
| Echantillons de contrôle | 0.196 | 0.202 |
| circle A: | 0.133 | 0.200 |
| circle B: | 0.172 | 0.198 |
| circle C: | 0.178 | 0.179 |
Graphically displaye, we get:
RT:
|
Glycolated:
|
Of course, the claim in the study is that the values are lower inside the circles than outside the circles, and that thus, the rate of crystalline material in the circles is "abnormal" compared to that outside of the circles.
But this reasoning is defective for a very simple and obvious reason:
The claimed "anomaly" is much more important between one circle and another that between the samples from the circles and the samples outside the circle!
One could thus just as easily claim things like: the crystallization in circle X is completely abnormal compared to that of the circle Y!
In other words, there is no anomaly at all!
The measurements above - which do not show any real statistical significance since they vary well more from one circle to the other than between circles and the control samples from outside the circles - were then given by BLT Research to Dr. Ravi Raghavan, a statistician.
Unfortunately, mistakes were made. To quote some of them:
The samples are now regarded as being two groups: those taken in the circle and those control samples taken outside the circles.
As we have seen, this made disappear the significant fact that the variation claimed to be the anomaly is more important from one circle to another than between the circles and the control samples!
Then, we are told that the Wilcoxon test, which justification is discussed further, was used. We are told that this particular test requires that the distribution of the samples and the controls are similar, and that this is so. But the sampling plan shows that it is not so. The Wilcoxon thus should not have been used. The NIDS review points out this wondrous use of statistics!
Finally, what happens at this step is rather simple: the stem nodes are longer in the circles than outside; which I am absolutely not disputing since this is a pseudo-anomaly that I already explained, it has nothing paranormal or alien about it, on the contrary, node growth is perfectly natural when plants are flattened by people. The statistician does not know this, obviously, he is involved in this for statistics, not for plants physiology expertise.
As all the samples are split in two groups, that of the circles and that of control, it is obvious that there is a correlation, since the variation of one circle to the other was jammed.
so there is no real demonstration that the least particular phenomenon took place at this step.
The reader surely noticed that for each sample, two measurements are given. One measurements is at the temperature of the laboratory, "room temperature" (RT) the other is the measurement made on the samples plunged in ethylene glycol or glycerol.
What happened is explained by Robert C Reynolds, Jr.: without glycolation, there may be a confusion in which smectites are measured as mica peak. This is why, in his review, he asked to take it into consideration and use glycolation.
This is done and the authors indicate that the statistics show that there is no significant difference between measurements with or without glycolation.
But what is more important is to understand what exactly Reynolds was supposed to check and he had in hand for this purpose.
In fact, BLT Research simply gave him only 9 samples, not identified, and what it confirms, from the factual point of view, is simply that there is really mica inside. He confirms actually the X-rays diffraction analyses by Dr. Sampath Iyengar are correct. No dispute on that!
He however gives a comment which is an interpretation of the results, ensuring that there is no known mechanism why there is more mica inside a crop circle ground than outside. This is where I disagree: the Earth absolutely not covered with a homogeneous quantity of mica everywhere! There are thus mechanisms that result in the fact that there is more mica in some place than in others. And of course, there is no need for revision of any scientific concept to explain that one crop circle is at a place where there is more mica than nearby!
"In short, I believe that our present knowledge provides no explanation for the observed decrease in peak breadth with respect to proximity to the center of the crop circle."
When he mentions a temperature from 600 to 800 °C which would be necessary in the laboratory, what he really means is that if there were no more mica there before the crop circle was found, if this "additional" mica came from the creation of the crop circle, if it had "appeared", then it would have required such heat, and that would have naturally destroyed the plants, so it is impossible.
What happened? Well, I guess that he was told that the increase of mica "appeared" during the formation of the crop circle... This, of course would be extraordinary. Unfortunately, it is only silly to assume that the excess mica appeared magically during the creation of the crop circle.
But the main point in this is that according to his review, the more you "go" towards the center of the crop circles, the more there is. Let's check.
circle A:
| Sample # | RT | Glycolated |
|---|---|---|
| 64 | 0.12 | 0.20 |
| 65 | 0.13 | 0.21 |
| 66 | Missing! | Missing! |
| 67 | 0.15 | 0.19 |
| 68 | Missing! | 0.19 |
These samples are taken in a diagonal line of circle A. We thus want to see a nice reversed bell-shaped curve, with the hollow in the center.
Obviously, it will not escape the reader that on the 5 listed samples, two are missing, among those, the one from the circle's center.
All we can use wth circle A is:
RT:
|
Glycolated:
|
Whatever the imagination you put at work with only 5 samples of which 2 are missing, you must note that instead of an increase of the mica peak in the center, there is less mica in the center than at the edge when using RT samples, and just the contrary when the samples were glycolated. Contrarily to the authors' claim, the glycolation is not insignificant, it changes the result entirely, and to negative results!
Circle B:
We saw that for circle B, the samples were from two orthogonal diagonal crossings:
circleB1:
| Sample # | RT | Glycolated |
|---|---|---|
| 41 | 0.30 | 0.20 |
| 42 | Missing! | Missing! |
| 43 | Missing! | Missing! |
| 44 | 0.17 | 0.22 |
| 45 | 0.14 | 0.17 |
| 46 | 0.14 | 0.18 |
| 47 | 0.13 | 0.14 |
| 48 | Missing! | Missing! |
| 49 | 0.17 | 0.18 |
| 50 | 0.17 | 0.14 |
| 51 | 0.23 | 0.23 |
RT:
|
Glycolated:
|
We see that if the distribution of RT values do show the drop in the curve supposed to convince, the values measured after glycolation shows a nearly reversed curve... whereas, according to the study, glycolation brought no significant change!
circleB2:
| Sample # | RT | Glycolated |
|---|---|---|
| 52 | 0.15 | 0.16 |
| 53 | 0.12 | 0.14 |
| 54 | 0.17 | 0.22 |
| 55 | 0.17 | 0.20 |
| 56 | 0.20 | 0.22 |
| 57 | 0.17 | 0.17 |
| 46 | 0.14 | 0.18 |
| 58 | 0.17 | 0.15 |
| 59 | 0.19 | 0.23 |
| 60 | 0.19 | 0.38 |
| 61 | 0.17 | 0.23 |
| 62 | 0.13 | 0.27 |
| 63 | 0.15 | 0.13 |
RT:
|
Glycolated:
|
We have here on this cross section of circle B more mica almost at the edges than at the edges, and a lack of mica in the center!
Circle C:
Circle C is the largest, and the one in which the highest number of samples were taken. We have seen that the values are:
|
|
|
|
This time I displayed the four samples lines on the same graph. If there were more crystallization in the center, you would get four lines in the graph, which would each start high, go down towards the center of the graph, and go up again at the other edge, something like this:
|
Not so: whether at RT or after glycolation, that's not at all what the true values below show!
RT:
|
glycolation:
|
What these curves shows is that the crystallization is completely random!
I thus wonder what miraculous logic is at work when proponents claim this is valid scientific proof that the crop circle of Edmonton, or any crop circle was not made by men!
At a certain place where a crop circle was made, the ground can be geologically different under the flattened crop and nearby. This is nothing paranormal, nor alien, and does not prove at all that the aliens or mysterious energies or whatever weird phenomena made the crop circle. But here, the claimed anomaly is not even significant, for it is more important between one and the other circle of the formation than it is when averaged between soil samples taking in and out of the formation. There is simply no anomaly at all!
And consequently, the proof that all crop circles are not done by land artists and pranksters must be found elsewhere.
I want to quote what I wrote on the matter during a discussion in the beginning of 2007, before digging more into the case and finding out that NIDS had also rejected the study. This was apparently was accepted (by lack of any reaction) or simply ignored (by Anne Moro who thereafter still claimed I have not explained the Edmonton crop circle "crystalized soil" which proves that it was not made by people), or possibly not understood at all because I had written it in English as is was first posted to my English-speaking UFO discussion group.